What is algorithmic trading?
Algorithmic trading is deciding what to buy or sell with a rule instead of a hunch — a rule precise enough that a computer can execute it and, more importantly, that you can test against history before risking a cent. This chapter sets the philosophy the rest of the course runs on. There is almost no math here; there is one hard idea, and it is a warning.
Systematic vs discretionary#
A discretionary trader looks at a chart, reads the news, feels the tape, and decides. A systematic trader writes down — in advance, unambiguously — exactly what conditions trigger a trade, how big it is, and when it closes. The systematic trader then does what the rules say, every time, whether or not it feels right in the moment.
The distinction is not “computer vs human”; it is “specified in advance vs decided in the moment.” You could run a systematic strategy with pen and paper. The reason we reach for code is that a rule written as code can be replayed against a decade of past data in seconds — and that replay is the only honest way to find out whether the rule was ever worth following.
| Discretionary | Systematic | |
|---|---|---|
| Decision | Judged per situation | Fixed rule, decided in advance |
| Testable? | No — can't replay a gut feel | Yes — replay the rule on history |
| Consistency | Varies with mood, fatigue, fear | Identical every time |
| Scales to N markets? | Not really | Trivially — run the same code |
| Failure mode | Undiagnosable | Measurable, attributable |
The loop: edge, rules, test, deploy#
All systematic trading is one loop, repeated forever. You form a hypothesis about a repeatable inefficiency (an edge), you encode it as unambiguous rules, you test whether the rules would have made money net of costs and — crucially — whether that result is more than luck, and only then do you deploy a small amount of capital and watch. What you learn feeds the next hypothesis.
- Edge — a reason prices should behave a certain way more often than chance: a behavioural bias, a structural flow, a slow diffusion of information. Without a why, a backtest is just a pattern you found by looking.
- Rules— the edge made mechanical: entry condition, exit condition, stop, and size. No free parameters left to “interpret” live.
- Test— replay on out-of-sample history, price in realistic costs, and run the statistical checks that ask “could a coin-flip strategy have looked this good?”
- Deploy— size it so a bad run can't ruin you, ship it small, and reconcile live results against the backtest's expectation.
Most beginners spend their time on edge and rules and almost none on test. This course inverts that. The hard, valuable skill is testing — because the market will happily hand you a hundred rules that fit the past and lose in the future.
Why rules beat gut#
Consistency#
A rule does the same thing on Monday and on the Monday after a three-loss week. A human does not. Most trading edges are thin — a small positive per trade that only compounds if you take every qualifying trade. Skip the scary ones (which are often the good ones) and you are no longer trading the strategy you tested; you are trading a subset selected by fear, whose expectancy is unknown.
Testability#
You cannot backtest a feeling. You can backtest a rule. A written rule turns “I think this works” into a number you can attack: expectancy, drawdown, and a p-value on whether the result survives a null hypothesis. If a claim can't be falsified on history, it can't be trusted with money.
No emotion#
Fear and greed are systematically wrong at exactly the worst moments — cutting winners early, holding losers, sizing up after a hot streak. A rule has no amygdala. It sizes the trade after five losses exactly as it sizes it after five wins, which is the only way the arithmetic of the edge is allowed to play out.
The research pipeline#
edgekit is organised as a pipeline, and so is this course. Each stage is a module you'll meet in depth; here is the whole arc in one breath so the pieces have somewhere to hang.
| Stage | Question it answers | edgekit module |
|---|---|---|
| Load | What is the data, really? | ek.data |
| Backtest | Would the rule have made money? | ek.strategy |
| Measure | How good, and how painful? | ek.metrics |
| Prove | Is it more than luck? | ek.validation |
| Size | How much can I risk without ruin? | ek.sizing |
| Ship | Will it survive a prop-firm / live account? | ek.challenge |
The order is not negotiable. You load before you trust the data (ek.data even ships an integrity_report so you look before you leap). You backtest a rule expressed as a BaseStrategy subclass. You measure withtrade_stats. You prove the result is not luck with a permutation test and walk-forward analysis — the stage that kills most ideas. Only survivors get sized and shipped.
import edgekit as ek

bars   = ek.data.load_bars("BTCUSDT_5m.csv")        # 1. load
h4     = ek.data.resample_ohlcv(bars, "H4")         # ... to a swing timeframe
trades = ek.strategy.SmaCross().backtest(h4)        # 2. backtest a rule (illustrative)
stats  = ek.metrics.trade_stats(trades.r, dates=trades.date)   # 3. measure
print(stats["ev_r"], stats["pf"])                   # expectancy per trade (R), profit factor
# 4. prove (ek.validation) -> 5. size (ek.sizing) -> 6. ship (ek.challenge)SmaCross or ORB precisely because they are honest, unglamorous examples.What a “strategy” is#
Concretely, a strategy is four decisions, and nothing more: when to enter, when to exit, where the stop sits (which defines your unit of risk), and how big the position is. In edgekit a strategy subclasses BaseStrategy and implements three methods — prepare (precompute causal indicator arrays), entry, and exit — and inherits a one-line .backtest() that runs the bar loop and returns trades priced in R-multiples (profit or loss measured in units of the risk you put on).
class MyIdea(ek.strategy.BaseStrategy):
    name = "my_idea"
    def prepare(self, bars): ...      # causal features (bar i sees only <= i-1)
    def entry(self, bars, P, i): ...  # return an EntryIntent, or None to stay flat
    def exit(self, bars, P, pos, i): ...  # return an exit price, or None to hold
Measuring outcomes in R rather than dollars is what lets you compare a crypto trade to an index trade and reason about sizing separately from signal. A strategy that is right about direction but reckless about R is still a losing strategy — which is why the exit and the stop are as much a part of the “idea” as the entry.
The prime directive: assume every edge is fake#
Here is the one belief this entire series is built on: most apparent edges are noise.Search enough rules over enough history and some will look spectacular purely by chance. A backtest's job is not to confirm your idea — it is to try to kill it. You are the defence attorney and the prosecutor, and the prosecutor has to be ruthless, because the market will not be kind to a rule you talked yourself into.
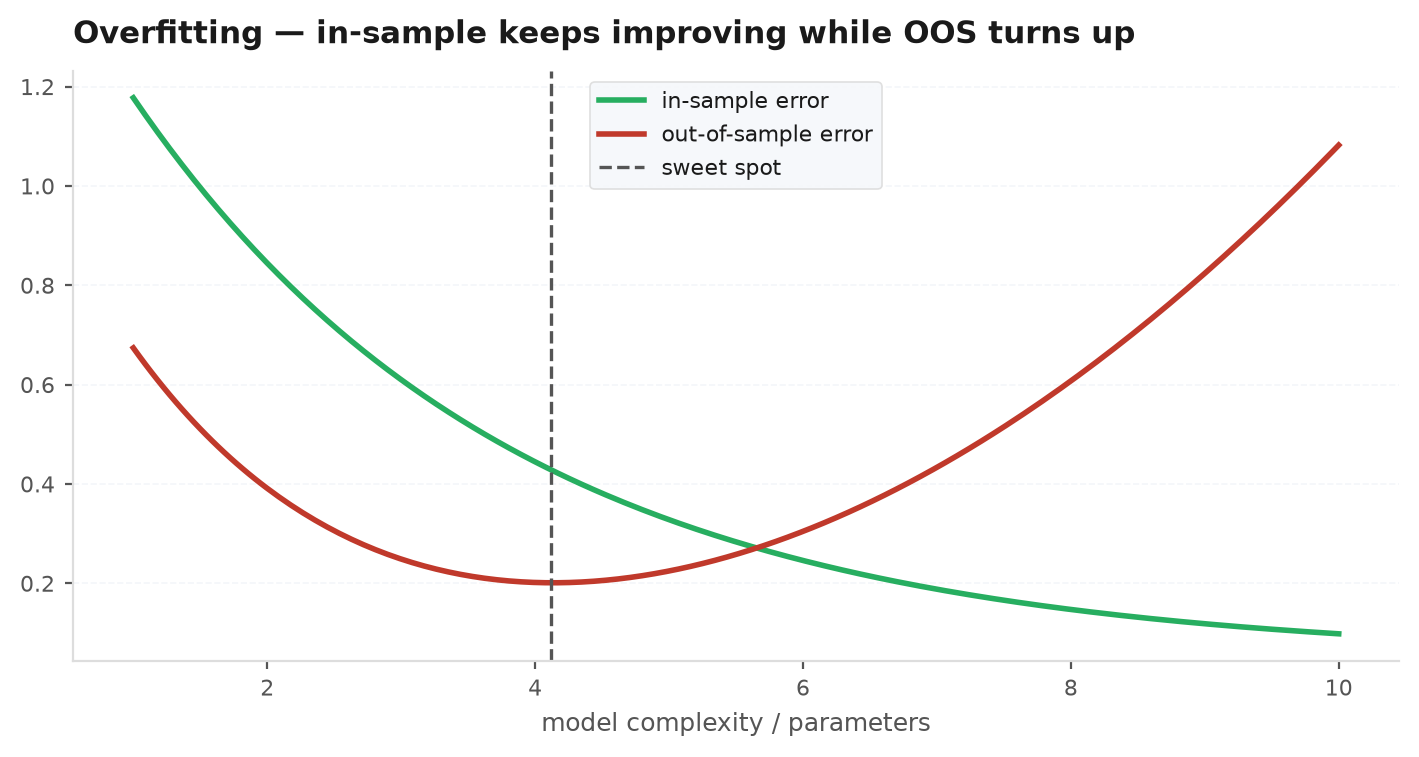
This is why the testing half of the course dwarfs the building half. The permutation test asks: if I shuffle the data to destroy any real signal, how often does a strategy this good appear anyway? Walk-forward asks: does the edge survive on data the rule was never fitted to? A held-out slice, read exactly once, gives you a single honest out-of-sample number. Skip these and you are not doing research — you are collecting flattering coincidences.
Next: with the philosophy set, we get concrete about what we're actually trading — the instruments, the anatomy of a price bar, and the costs that quietly eat returns — in Markets, instruments & data.