Prove the edge.
edgekit takes a trading idea from raw bars to a validated, sized, deployable strategy — with a prime directive baked in: assume every edge is fake until proven otherwise.
import edgekit as ek

# load -> backtest -> PROVE -> (size -> ship, only if it survives)
bars   = ek.data.load_bars("US100_M1.csv")
rth    = bars[ek.data.rth_mask(bars.index)]            # Nasdaq cash session
trades = ek.strategy.ORB(or_bars=30, target_r=2.0).backtest(rth)
stats  = ek.trade_stats(trades.r, dates=trades.date)   # PF 0.71 · EV -0.21R

p = ek.validation.mcpt(trades.r.sum(), null_stat, n=1000)
print("REAL EDGE" if p < 0.01 else "rejected")         # -> rejected: dead after costs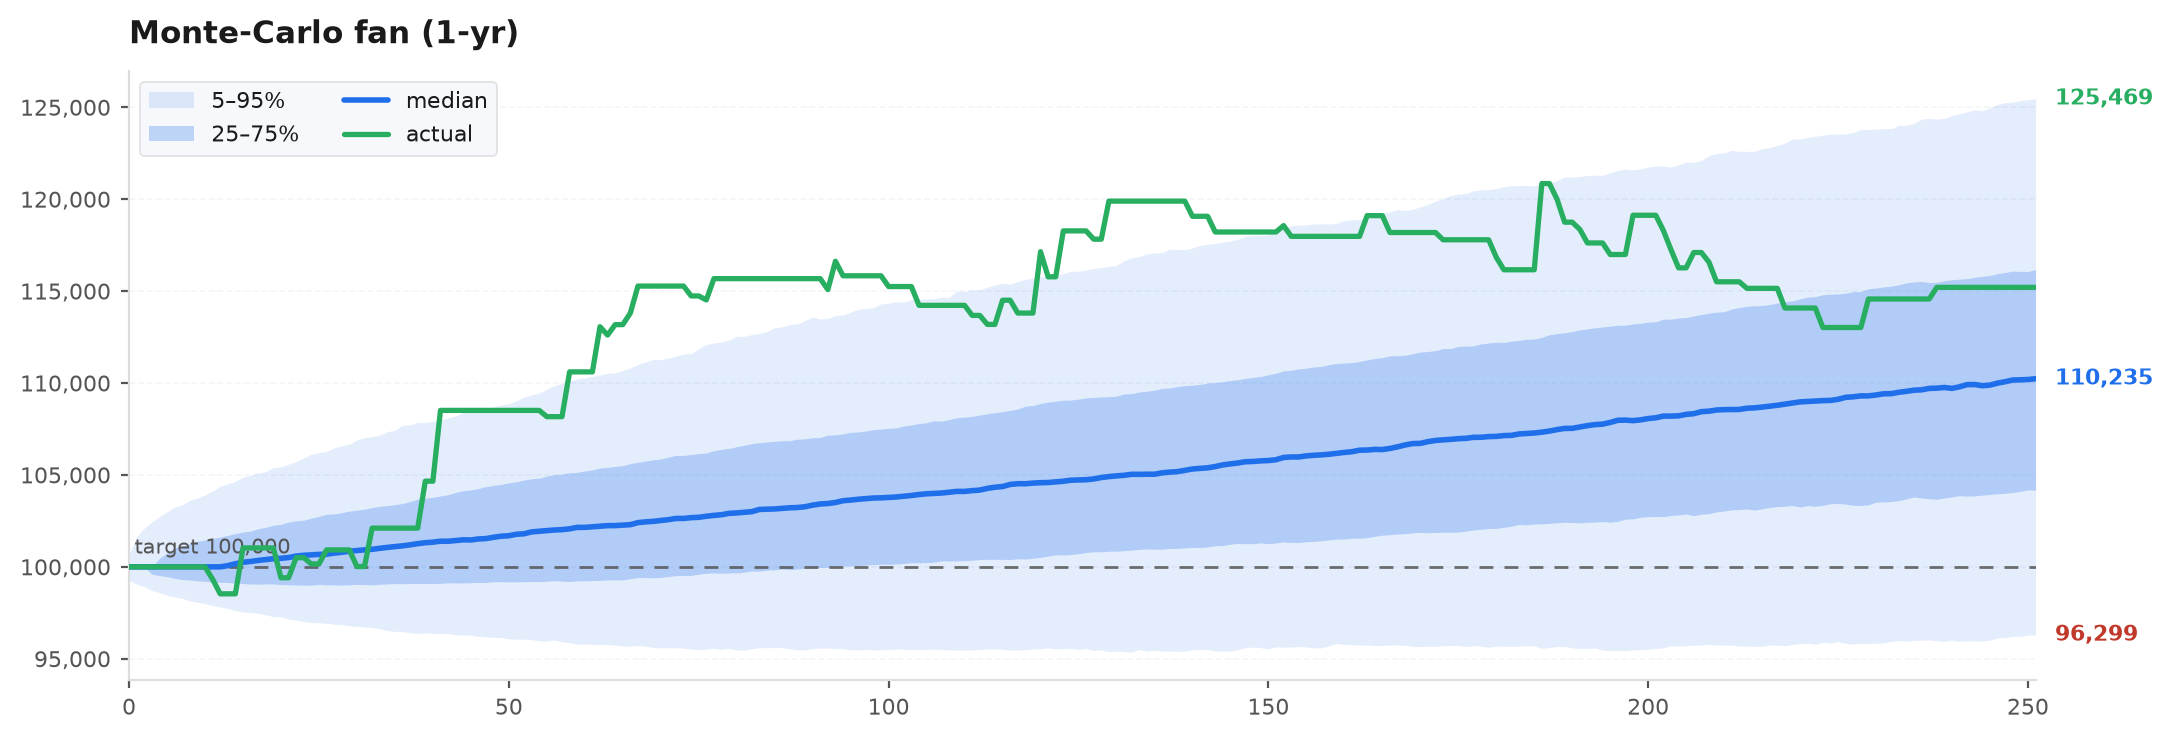
The pipeline
Causality is tested, not hoped
Indicators are returned unlagged; you lag explicitly. Property tests perturb future bars and assert the past never moves — the look-ahead class of bug fails CI.
The permutation gauntlet
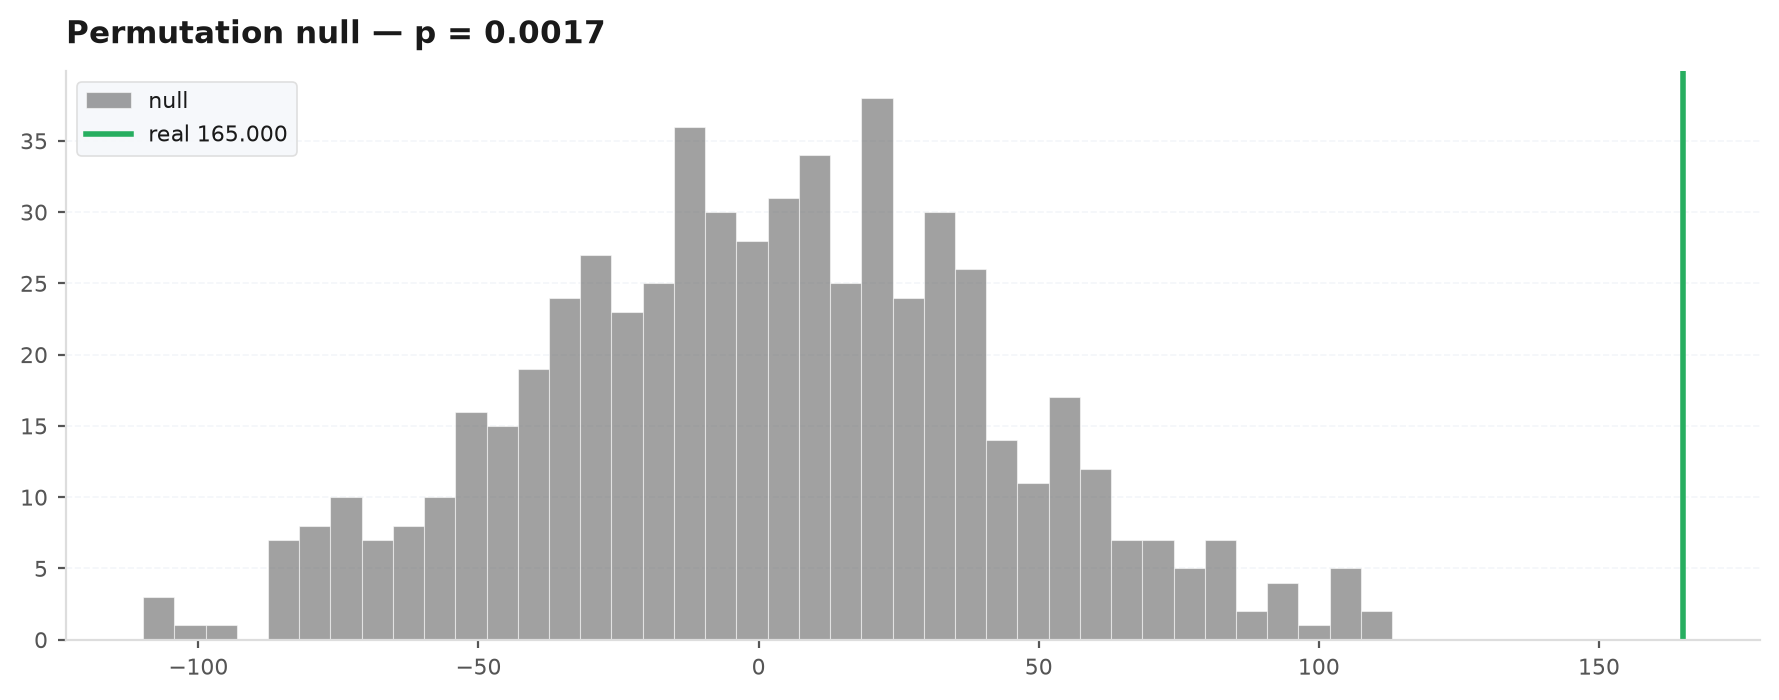
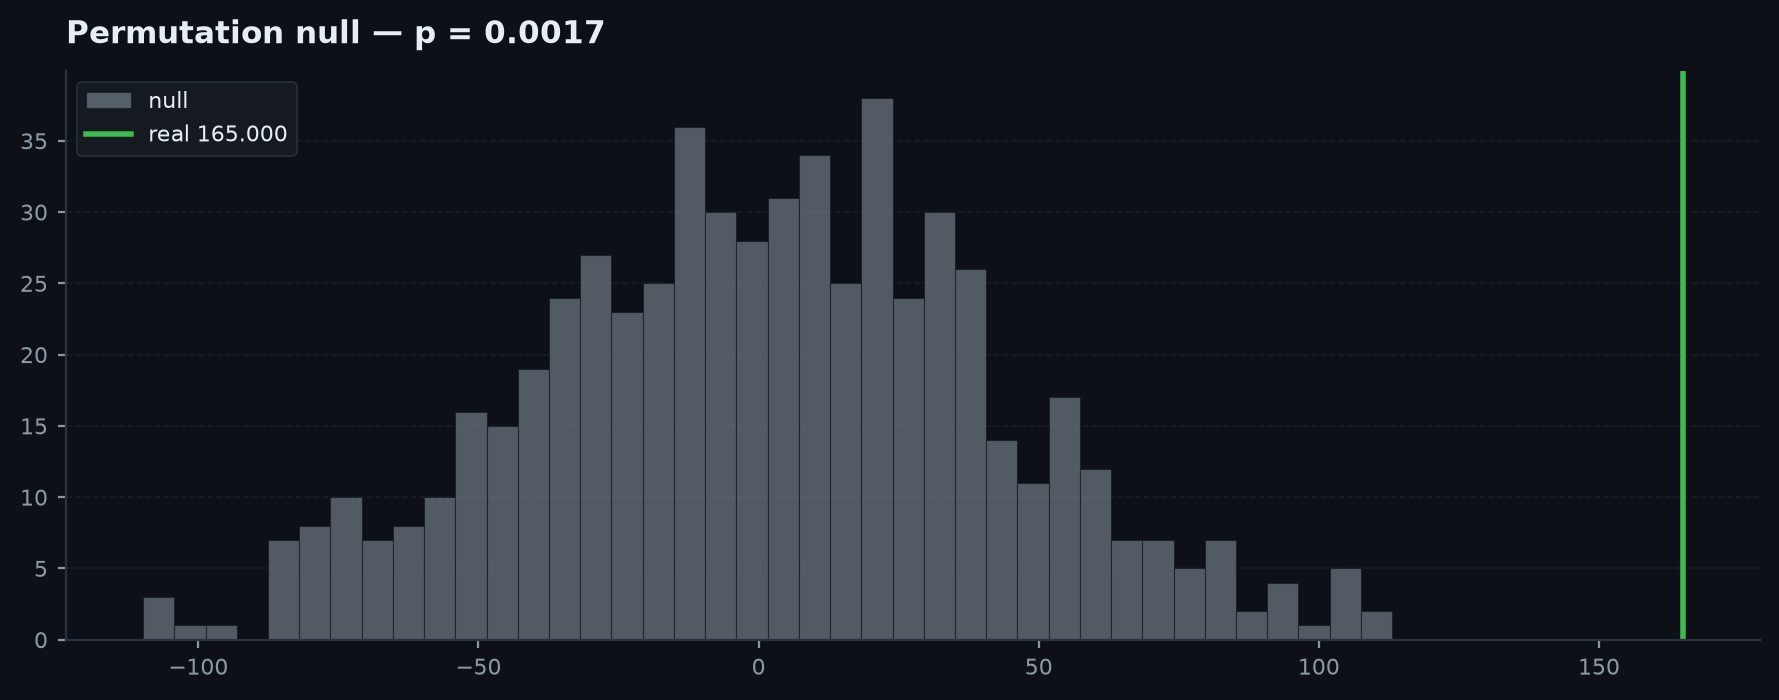
Shuffle bar order to kill the trend, re-run, build a null. p < 0.01 = real edge. A no-edge strategy correctly scores non-significant — the test refuses to bless noise.
R-multiple is the currency
Strategies emit trades priced in units of their own risk. Dollars come once, later, from a single sizing scalar — never baked into the signal.
Prop-firm ready
Simulate FTMO / CryptoFundTrader / BrightFunded evaluations — pass-rate and days-to-pass by Monte-Carlo, sized to the exact drawdown rules.
Cloud-safe ML export
Triple-barrier labels, purged walk-forward, then serialize trees to pure-Python/C# inference that matches sklearn within 1e-6 — no sklearn at runtime.
Self-contained reports
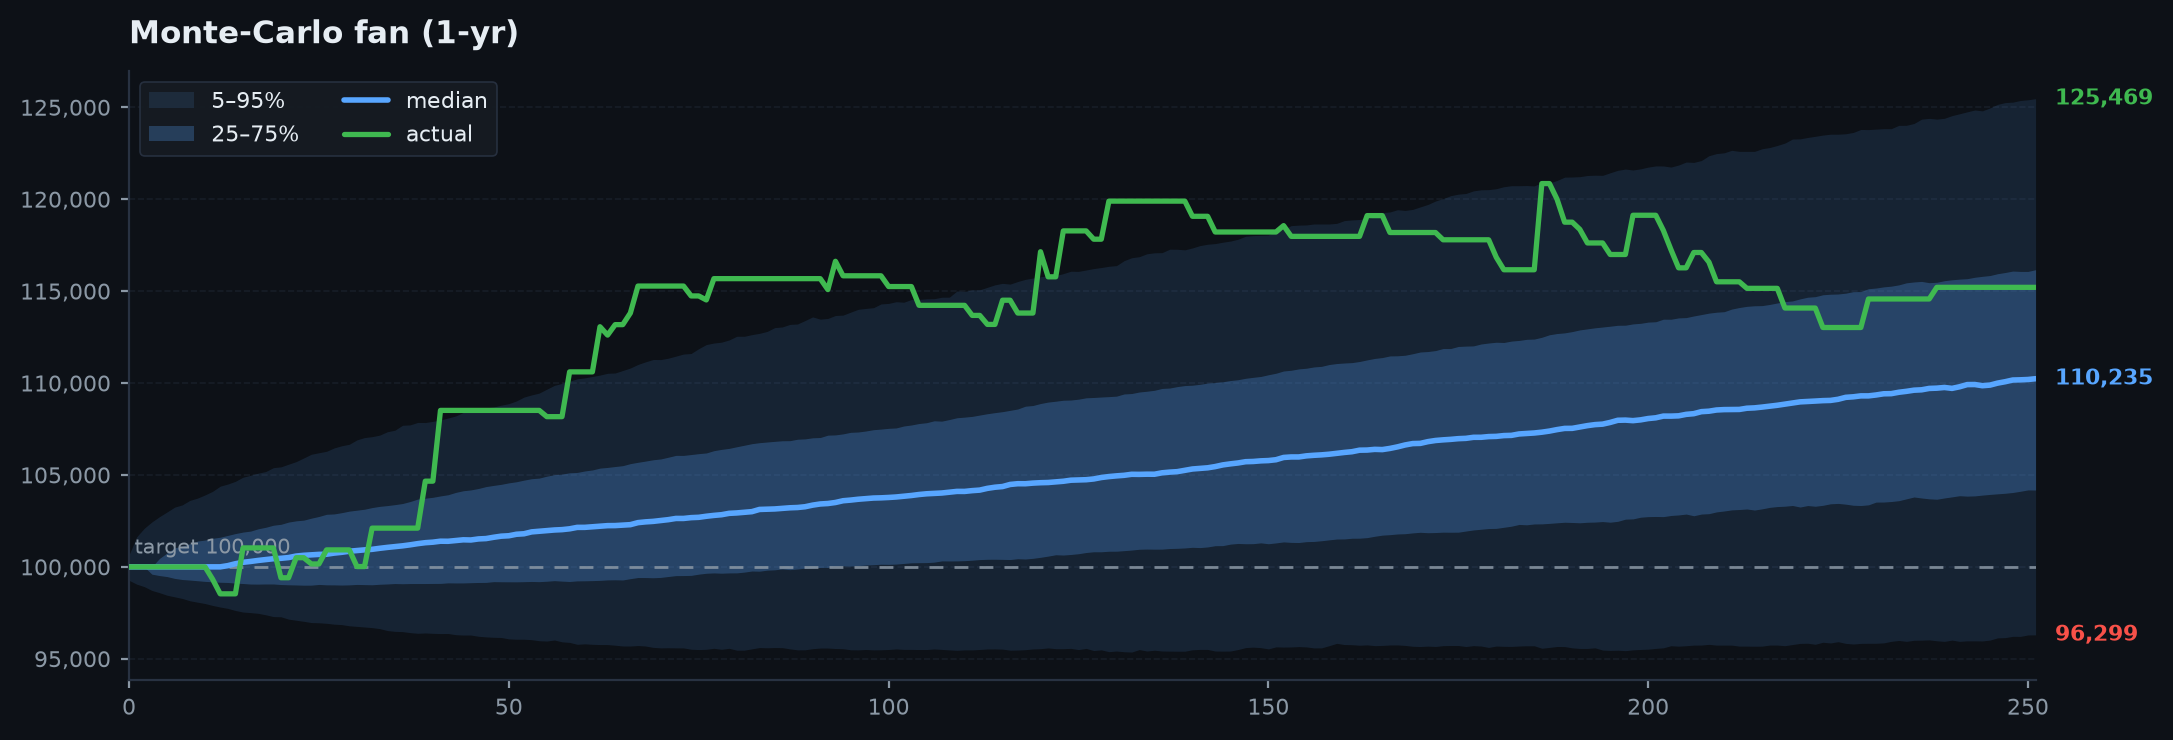
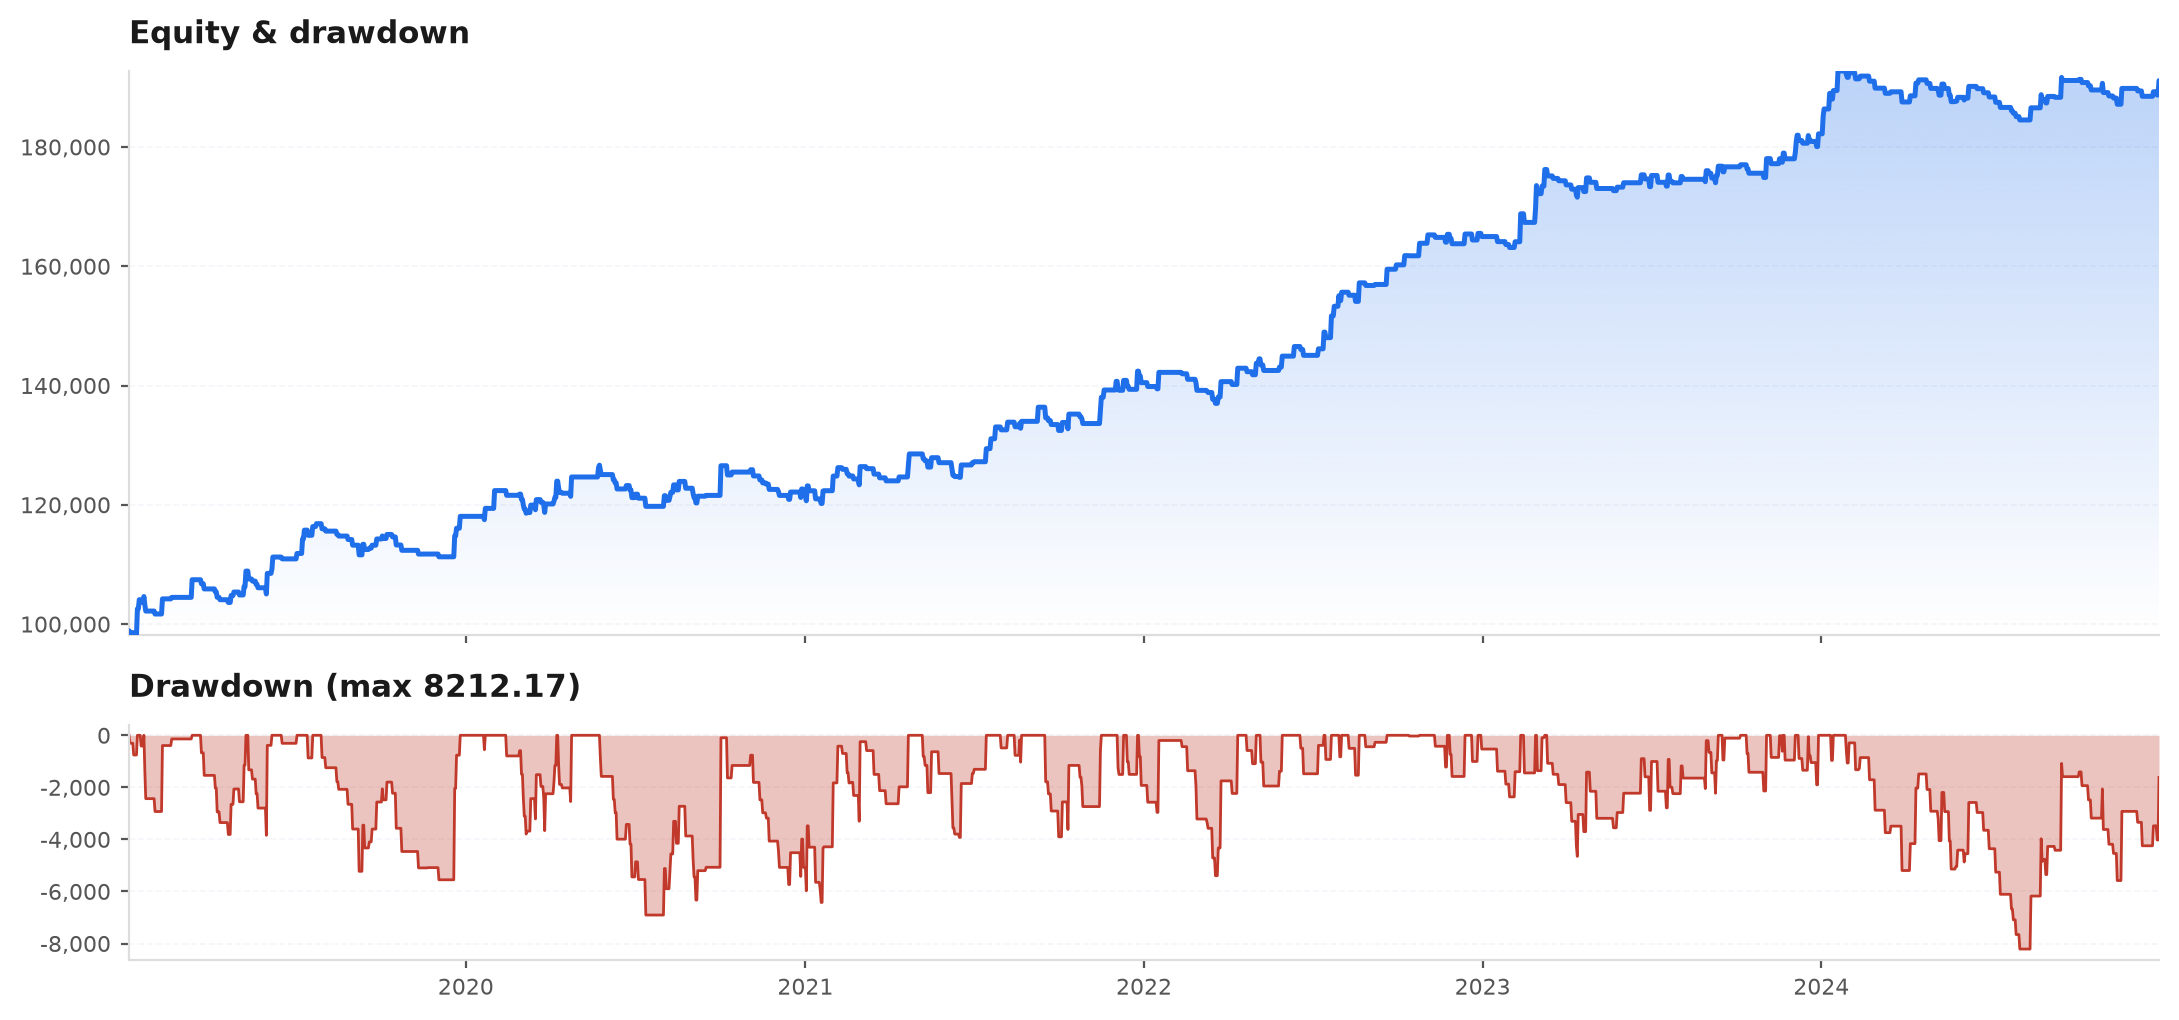
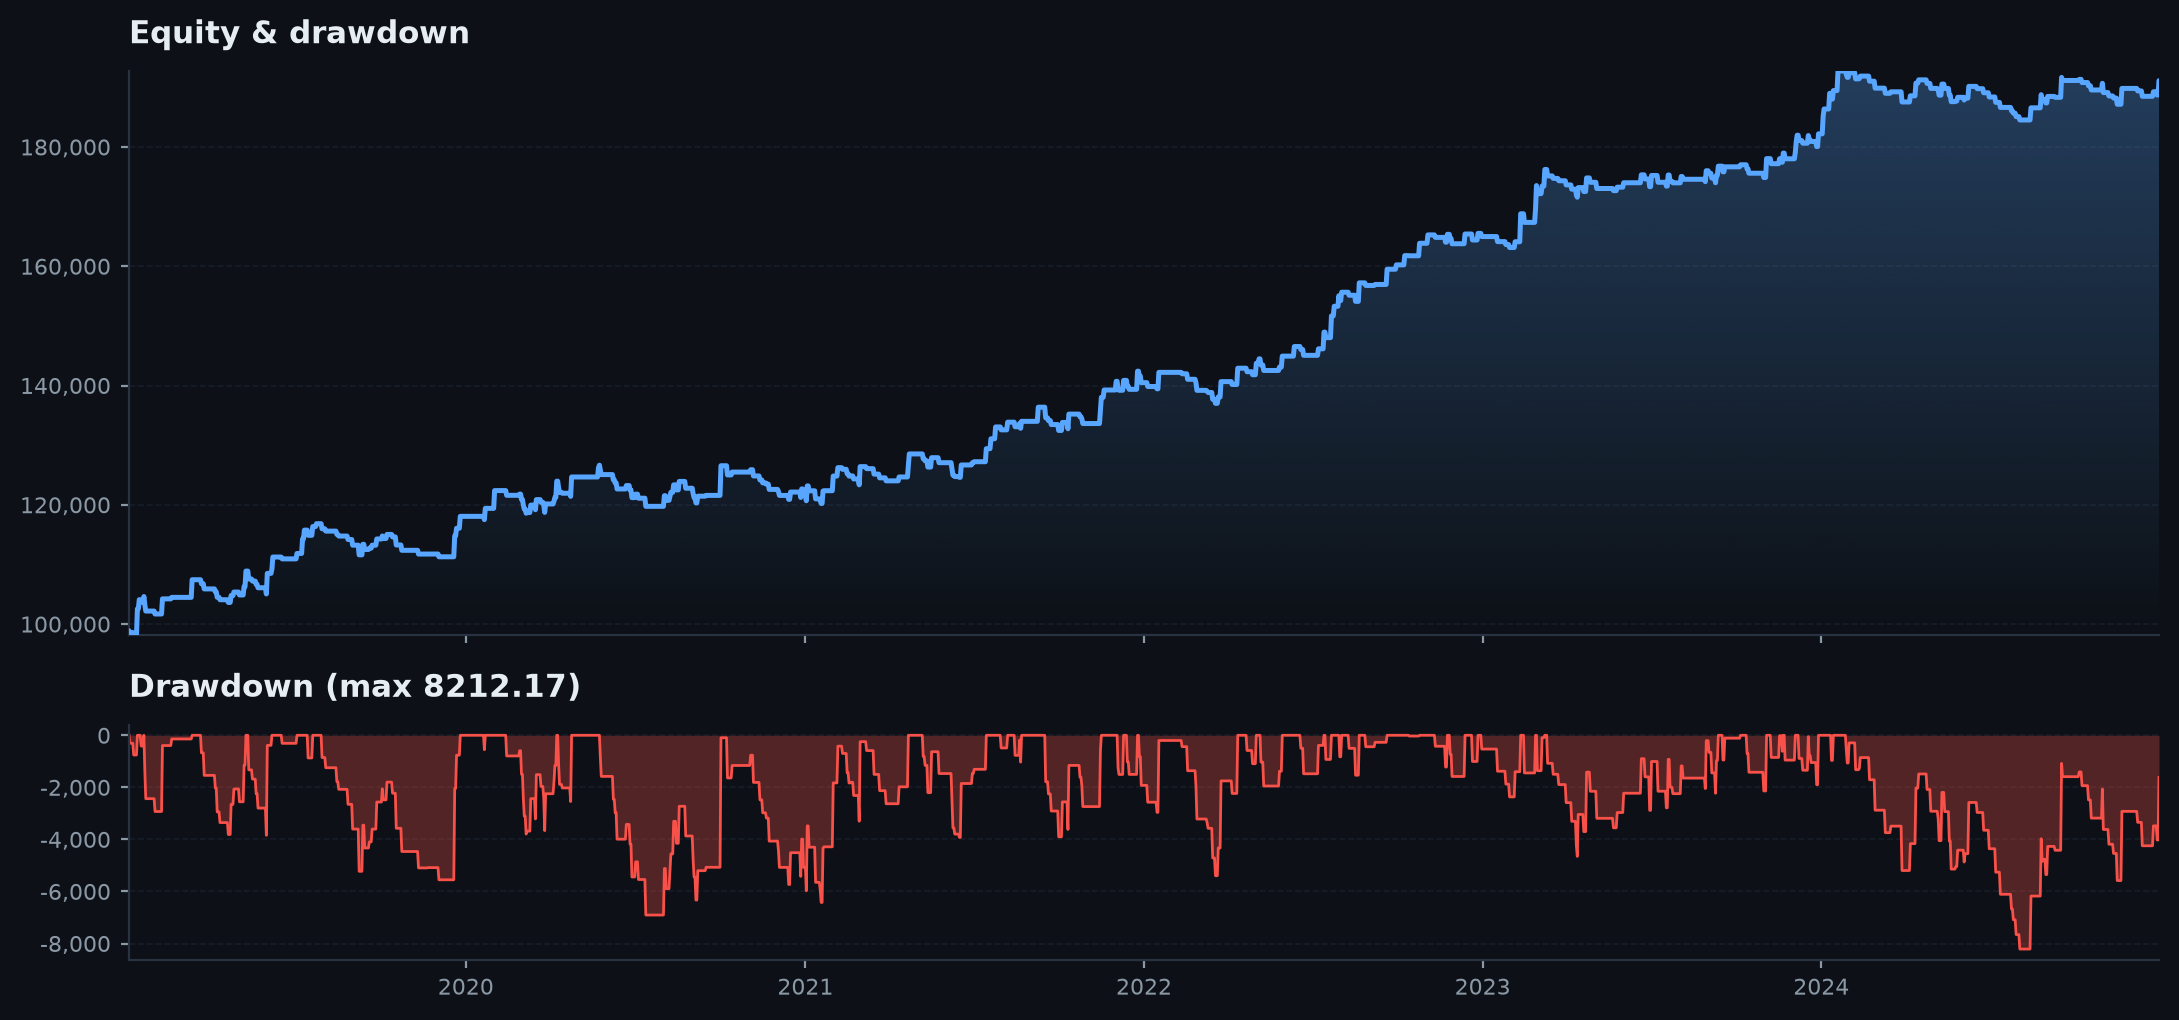
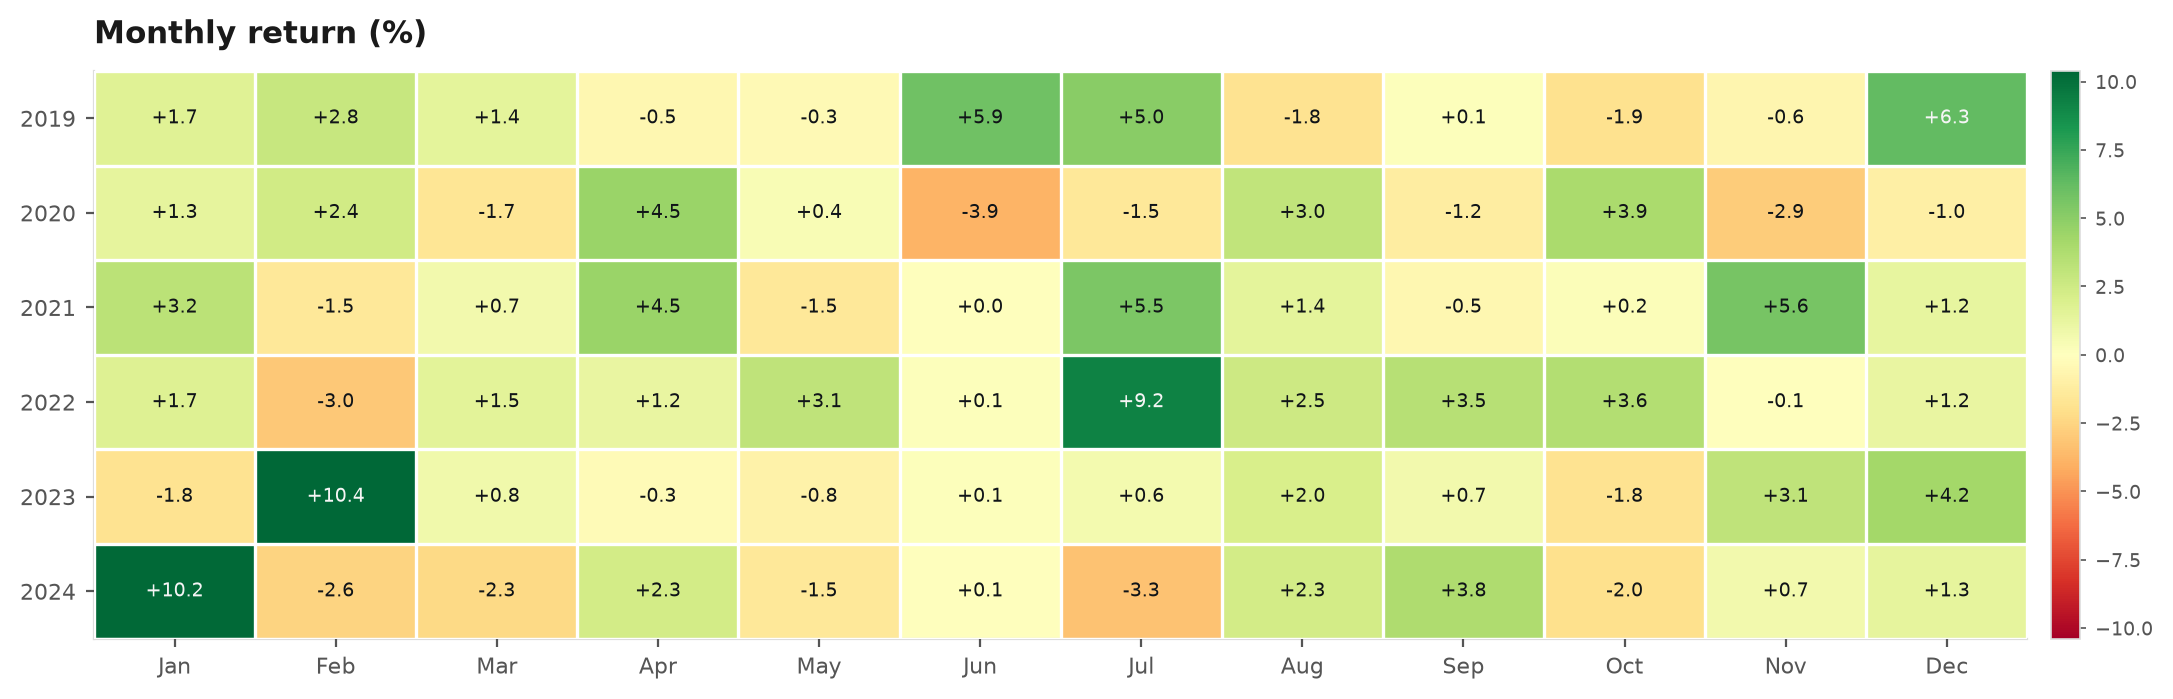
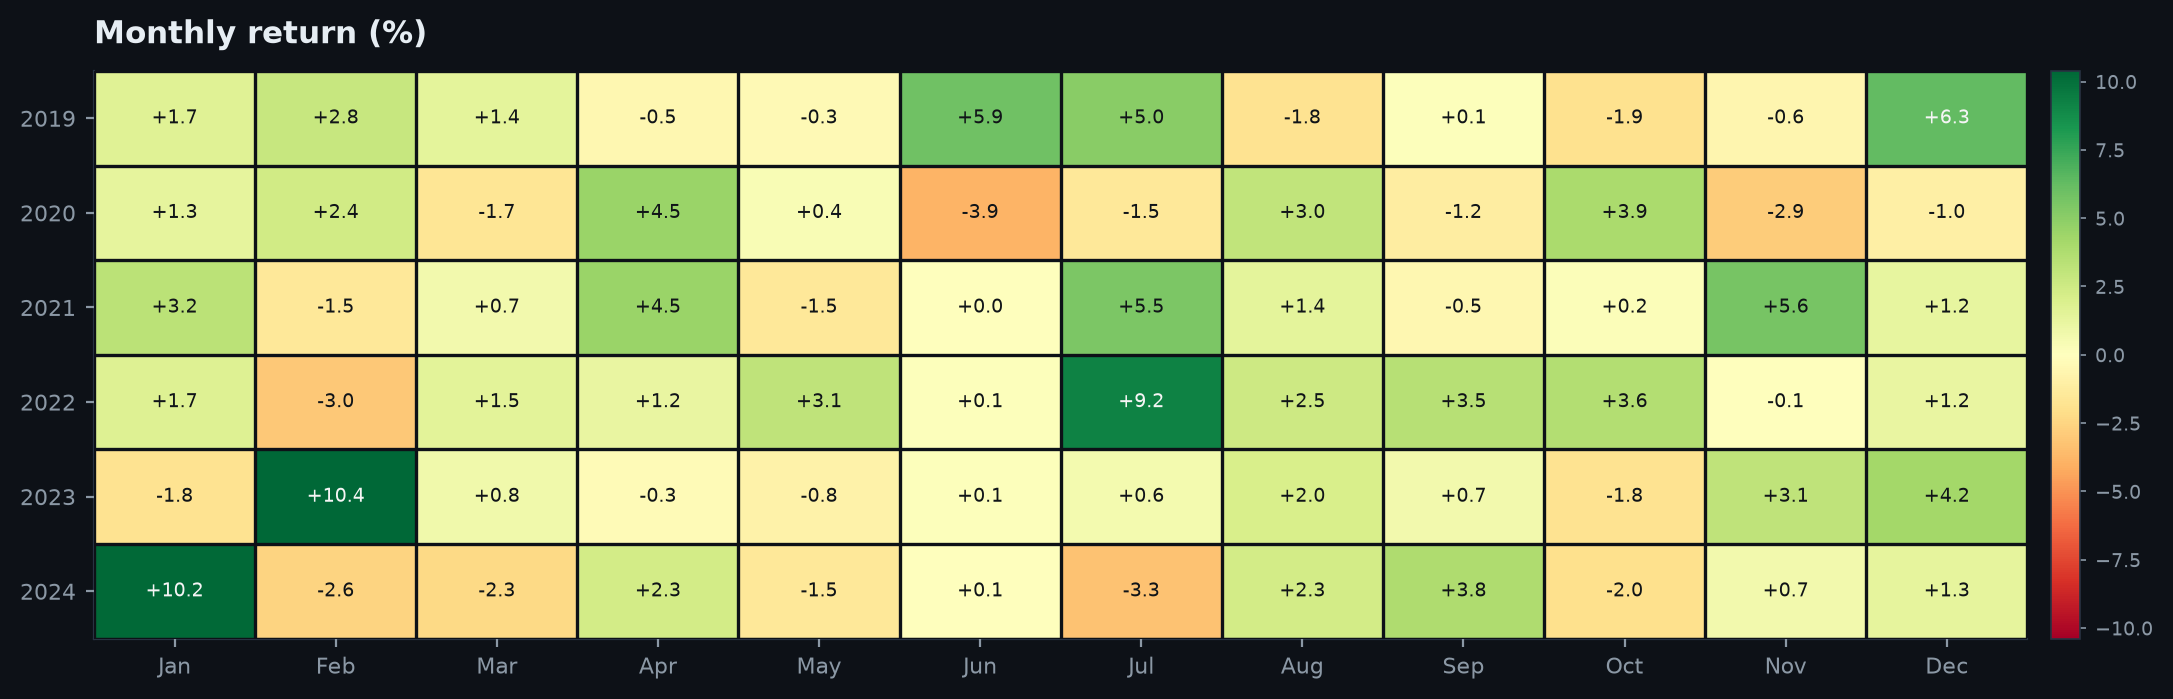
One call renders a themed HTML report with equity curve, Monte-Carlo fan, and monthly heatmap — every image base64-inlined, zero external requests.
Charts that go straight into a report
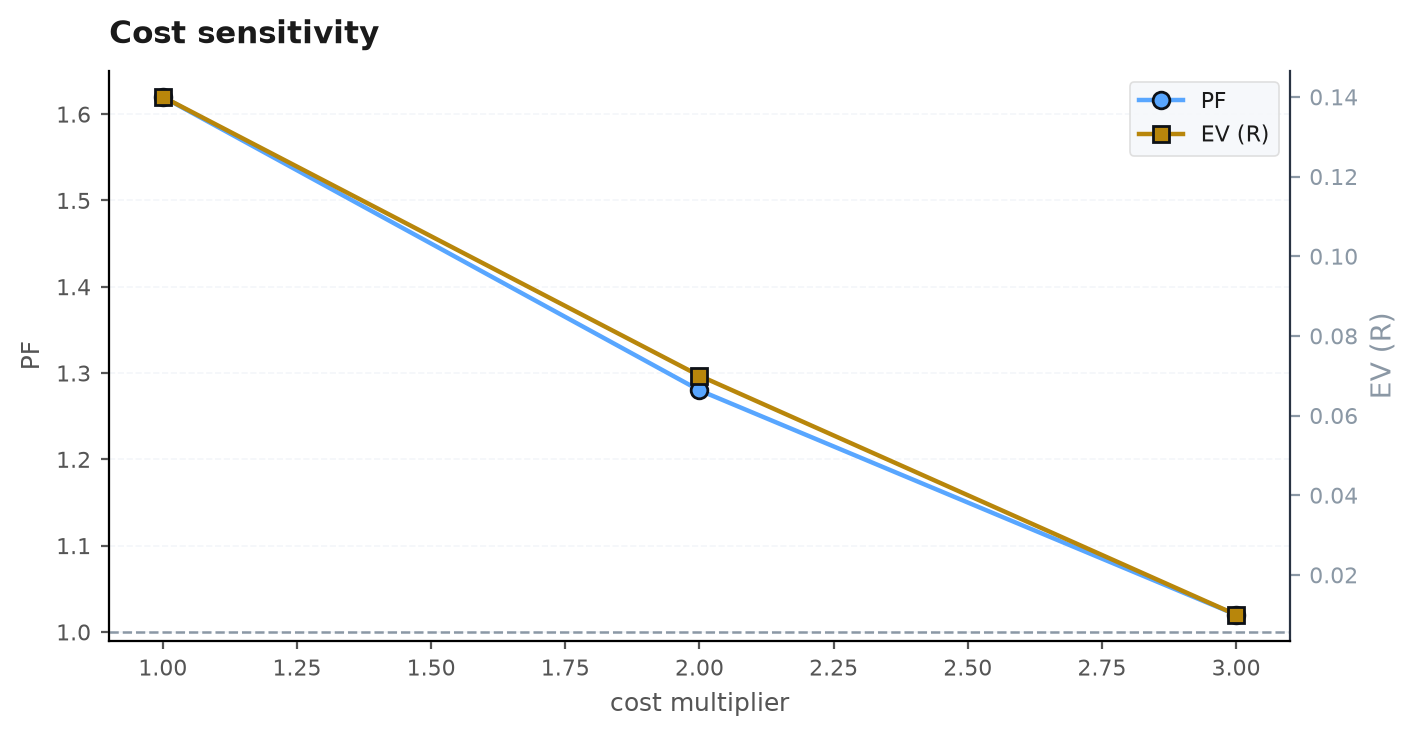
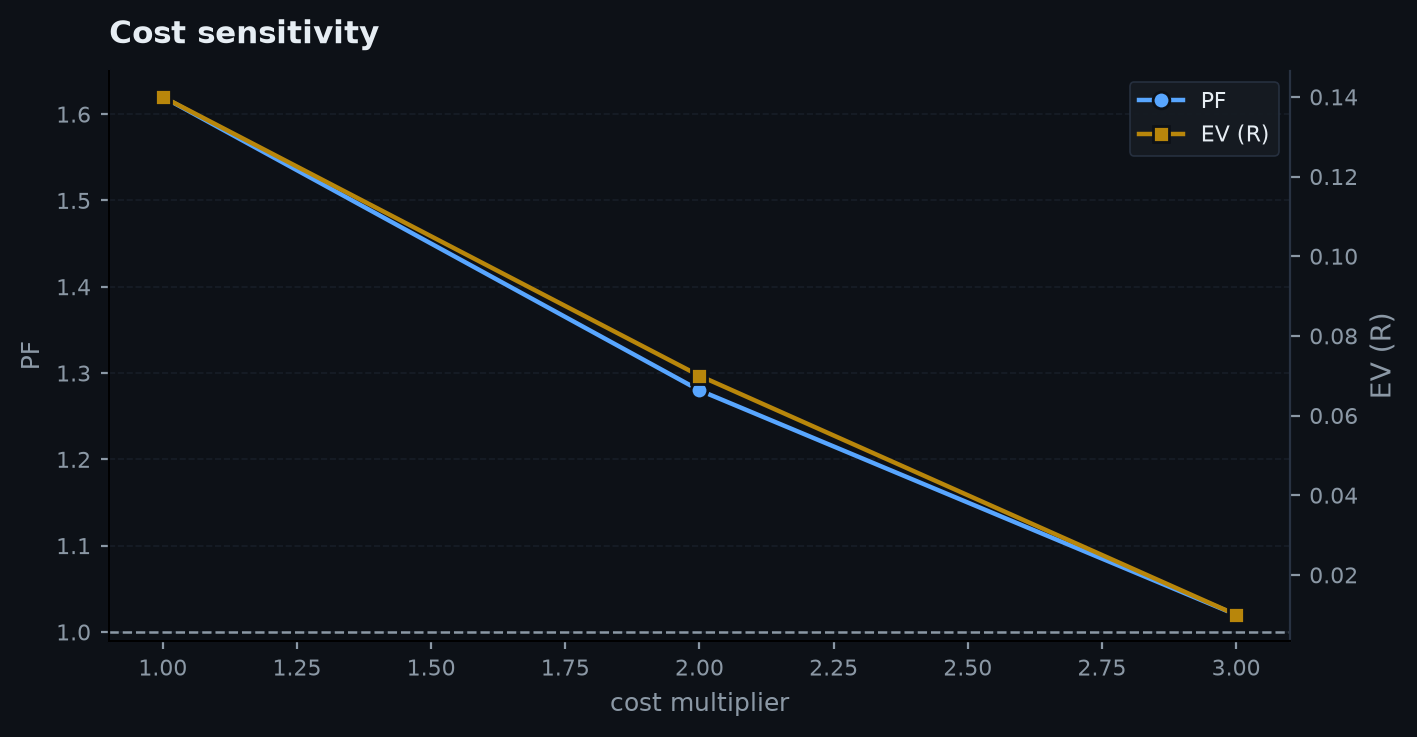
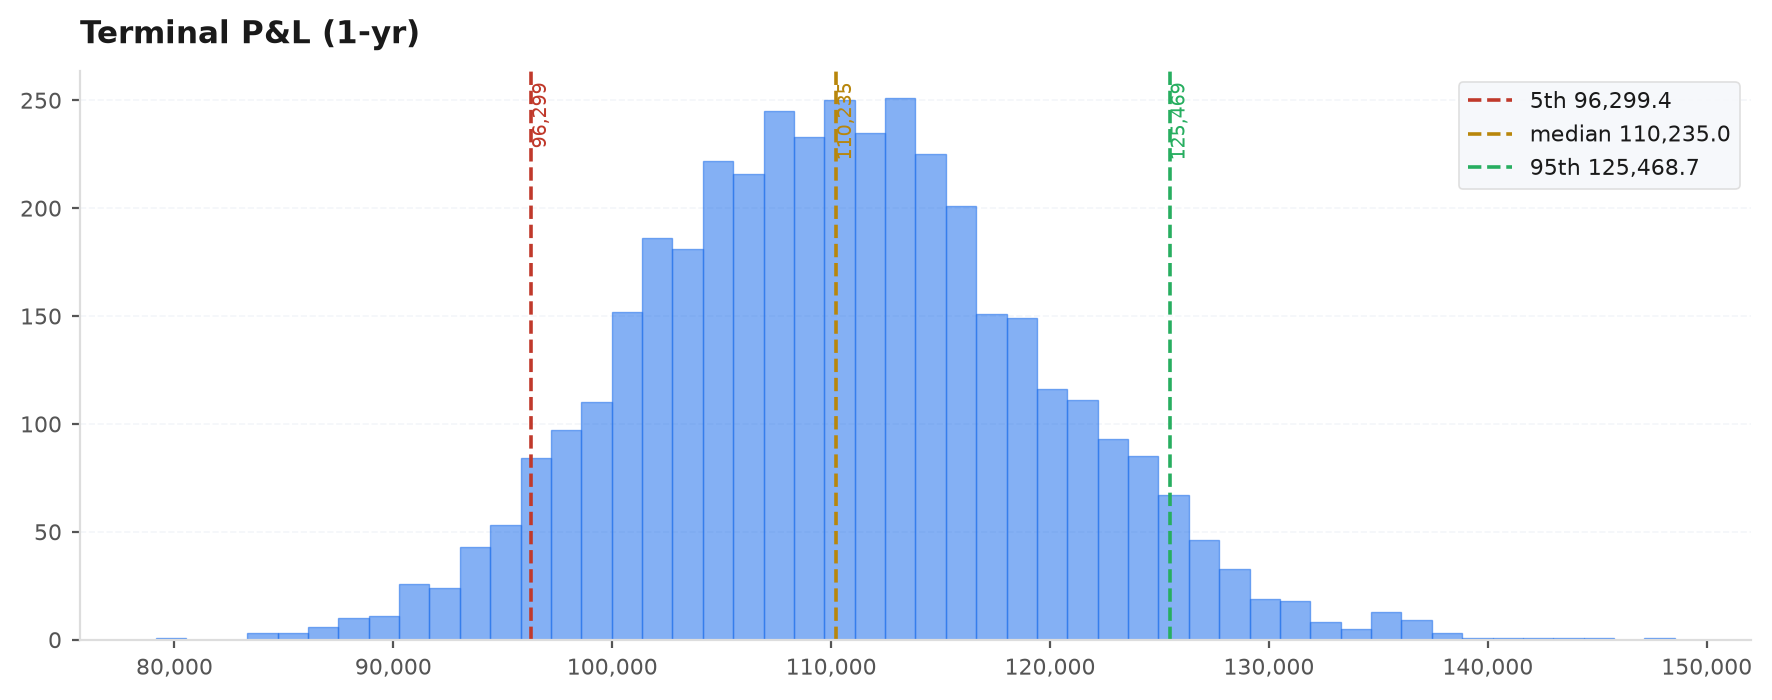
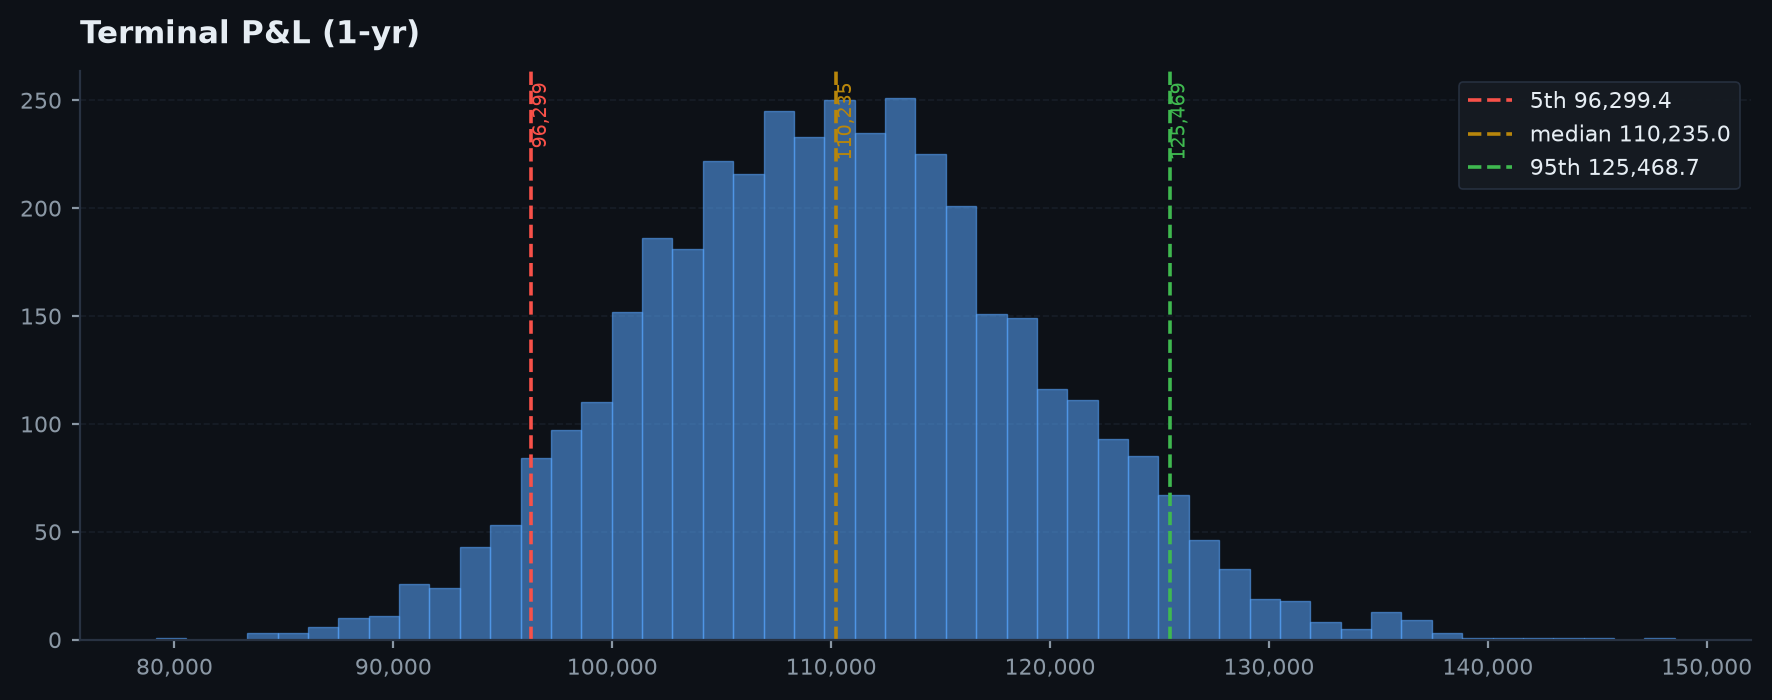
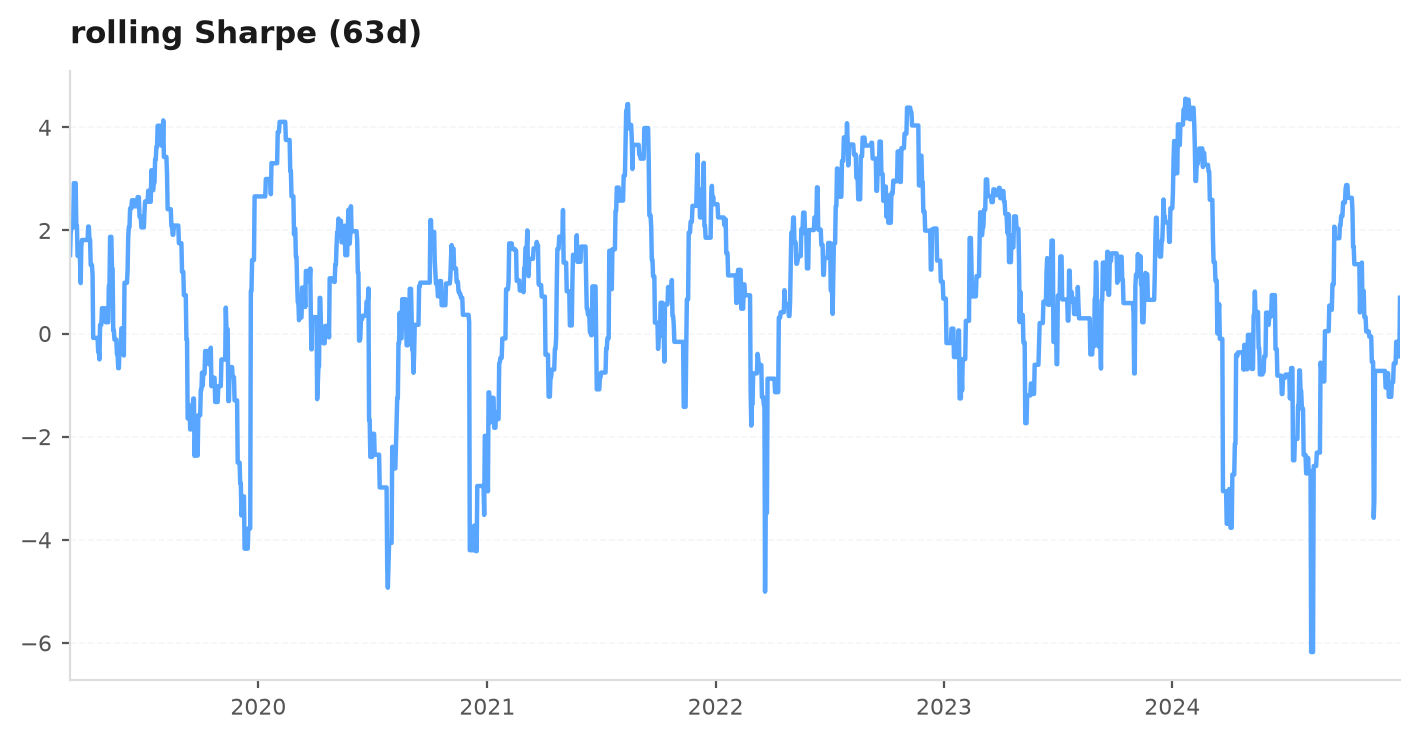
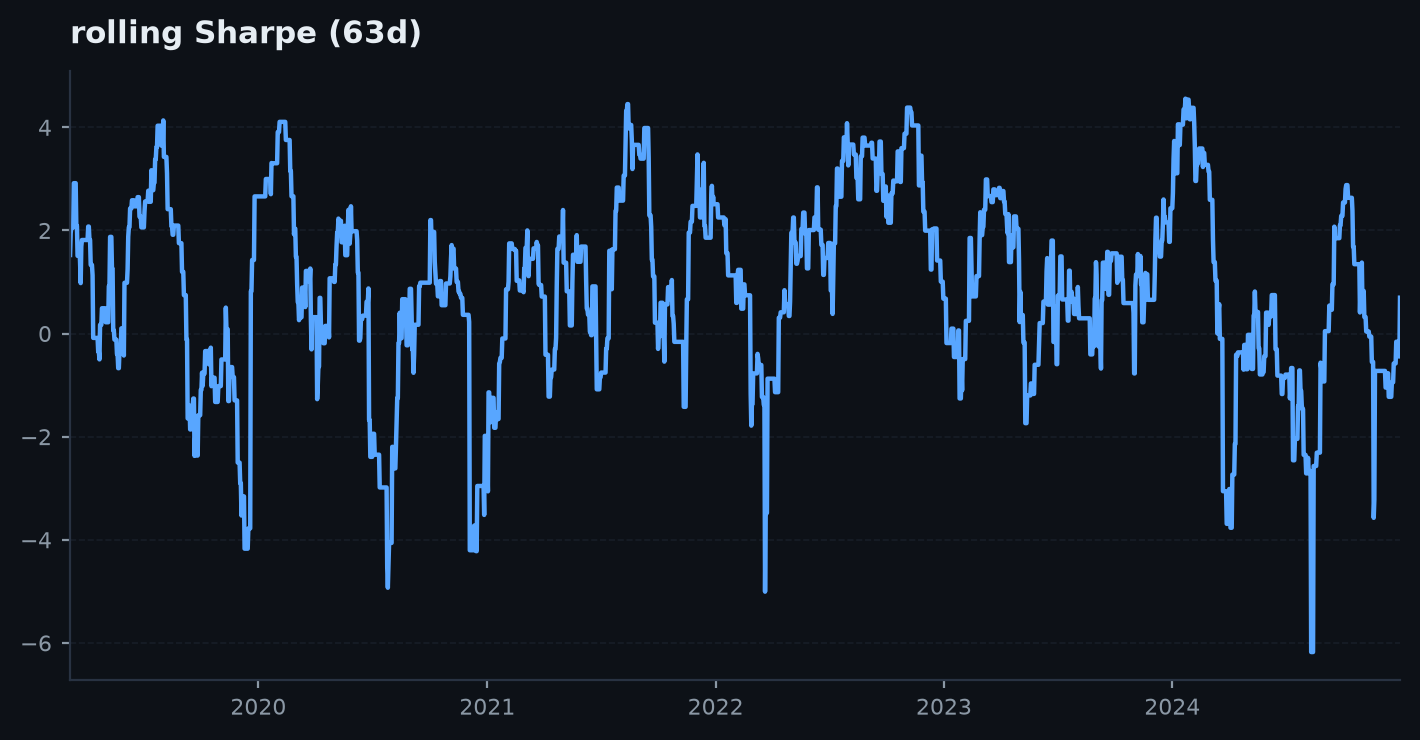
The viz module renders publication-quality charts in light or dark, and tear_sheet() assembles them into one self-contained HTML report. A few of them:
Learn algorithmic trading, end to end
A complete, math-grounded course — from what a market is, through the probability and statistics that decide whether an edge is real, to building, testing, simulating, and shipping strategies. Every idea is made concrete with edgekit.
Probability & statistics for quants
The intuition-first theory course — 33 chapters of definitions, theorems with proofs, worked examples, simulations, and the classic problems on every topic: combinatorics to martingales, Markov chains to the bootstrap.
Twenty-five composable modules
One clean, tested package — replacing ~280 copy-pasted research scripts. Core is numpy + pandas; matplotlib, scikit-learn and friends are lazy extras.
coreR-multiple + OHLC contract, lag(), Signal/Trade, RNGdataload, fetch, resample, RTH, integrity, alt bars, fundingindicatorsatr, adx, donchian, hawkes, rsi, hedge, half-lifetimeseriesreturns, vol, ACF, fracdiff, spectra, Kalman, entropysimGBM, Merton, Heston, GARCH paths; antithetic, Haltonenginerun_bar_loop + Strategy protocol, run_backtestcostsCostModel (fraction & pips), cost_stressexecutionAlmgren-Chriss, sqrt impact, TWAP/VWAP, shortfallmicrostructureRoll & CS spreads, Amihud, Kyle lambda, VPINmetricstrade_stats, MAE/MFE, PSR, edge decay, capacityriskVaR, CVaR, Cornish-Fisher, EVT (GPD, Hill), drawdowndependencerank corr, copulas, tail dependence, corr MSTsizingrisk_parity, hrp, vol_target, cppi, dd_throttleallocateThompson, UCB, EWMA weights, regret — online allocationoptimizemean-variance, Black-Litterman, MP denoising, ERCfactorsOLS, CAPM, Fama-MacBeth, Newey-West, event studiesvalidationthe gauntlet — permutation, PBO, DSR, walk-forwardstrategyBaseStrategy + templates: ORB, SmaCross, pairs, carryportfoliobook combination, allocation sweep, correlationchallengeprop-firm simulator, pass-rate, days-to-passmonitorCUSUM, PSR monitor, live reconciliation, kill switchoptionsBlack-Scholes price + Greeks, implied volvizmatplotlib charts + themesreportself-contained HTML reportsmlfeatures, triple-barrier, purged WF, tree exportStart with a backtest you can trust.
Ten minutes to your first causally-validated result, permutation p-value and all.