Overfitting detection
The most dangerous backtests are the ones that look best, because the surest way to a great backtest is to try many things and keep the winner. This chapter is about catching that: reading a parameter surface for a plateau vs a knife-edge, estimating the probability of backtest overfitting with CSCV, and deflating the Sharpe by the number of trials you actually ran.
The trap is human, not mathematical: you try things until something works, then remember only the thing that worked. Every discarded variant was a hidden lottery ticket, and the winner is partly just the luckiest ticket. This chapter is three ways of asking "how lucky was my winner, really?" — is one strategy stable when you nudge its dials (plateau vs knife-edge), does being the in-sample best predict anything out-of-sample (PBO), and does the winning Sharpe survive a correction for how many tickets you bought (deflated Sharpe). We will put real-ish numbers through each.
Parameter robustness — plateau vs knife-edge#
A real effect is robust to its knobs. If a strategy works with a 200-bar filter, it should work almost as well at 180 or 240 — the parameter surface is a smooth plateau. An overfit strategy shows a lone towering spike: it is excellent at exactly one value and mediocre on either side, because that one value happened to fit the noise.
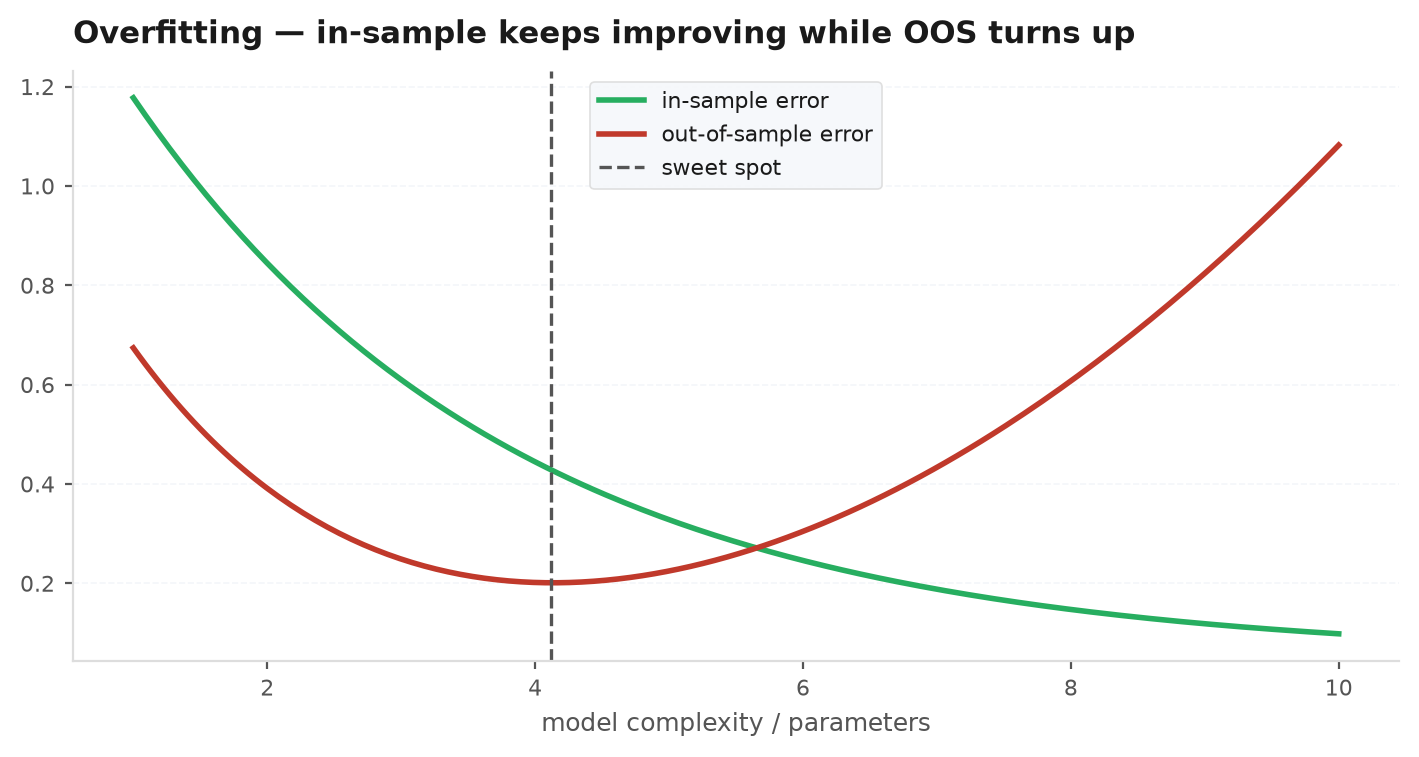
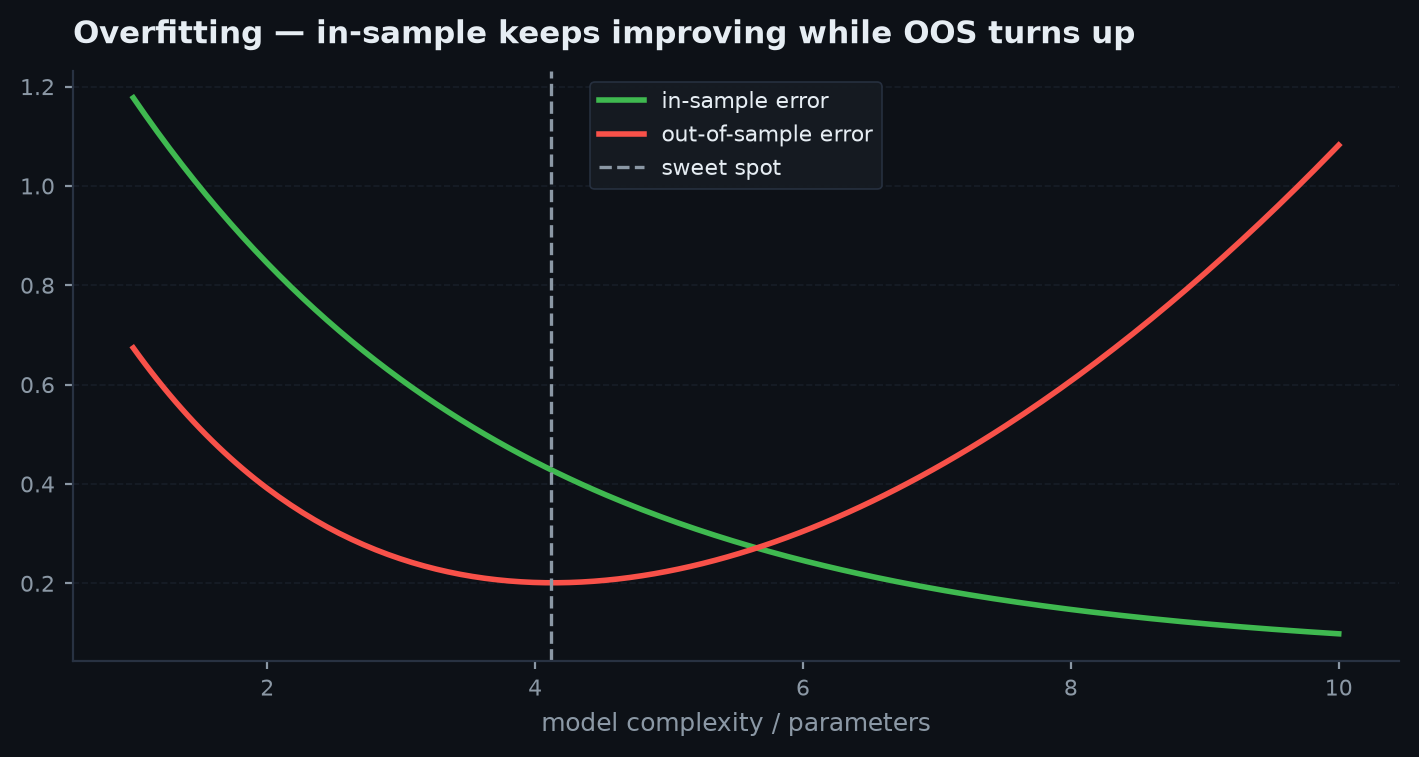
param_sweep quantifies this. It runs your strategy across a grid and reports the min, median, and max Sharpe plus the spread. A tight spread with a high median is a plateau; a huge spread dominated by one max is a lucky corner of parameter space.
import edgekit as ek
from edgekit.strategy import ORB

def run(n):
    trades = ek.engine.run_bar_loop(rth, ORB(or_bars=n), warmup=5, bars_per_day=390)
    return ek.trade_stats(trades.r, dates=trades.date)["sharpe"]

sweep = ek.validation.param_sweep(run, grid=range(15, 61, 15))
print(sweep["sharpe_min"], sweep["sharpe_median"], sweep["sharpe_max"], sweep["spread"])
# tight spread, high median -> plateau (trust it); lone max -> overfit{15, 30, 45, 60} minutes on US100. Strategy A returns Sharpes [0.9, 1.1, 1.0, 0.85]; strategy B returns [0.1, 1.6, 0.2, 0.0]. Both have a max around 1.1–1.6, so a headline that quotes the best value makes B look better. But A is a plateau — median 0.95, spread 0.25, it works everywhere in the neighbourhood — while B is a knife-edge: the median is ~0.15 and the whole result hangs on the single 30-minute value fitting that sample's noise. In live trading you will not reliably sit on the exact optimum, so A's median 0.95 is roughly what you get and B's realistic expectation is ~0.15. Report the median and A wins; report the max and you ship B.Probability of backtest overfitting (PBO via CSCV)#
When you try many configurations, the question is not "is the winner good in-sample?" but "does being the in-sample winner predict anything out-of-sample?" Combinatorially Symmetric Cross-Validation (Bailey & López de Prado) answers it directly.
How CSCV works#
Take a matrix of per-period returns — one column per config you tried. Split time into blocks and form every balanced train/test partition (half the blocks in, half out). In each partition, find the config that was best in-sample, then look up its rank out-of-sample. PBO is the fraction of partitions where the in-sample winner lands in the bottom half out-of-sample:
If picking the in-sample best gives you a coin flip out-of-sample, PBO ≈ 0.5 and your selection has no predictive power. Rule of thumb: is overfit; is acceptable.
import edgekit as ek

# M is a T x Nconfig matrix of per-period returns, one column per config tried
pbo = ek.validation.pbo_cscv(M, S=16)
print(pbo["pbo"], pbo["median_logit"])   # want pbo < 0.35
Scenario. You have a matrix of daily returns, one column per ORB filter-combination you tried. CSCV splits time into blocks and forms every balanced half-in/half-out partition. In each one it finds the config that topped the in-sample half, then checks its rank on the held-out half. If pbo comes back 0.55, then more than half the time your in-sample champion landed in the bottom half out-of-sample — picking the backtest winner is worse than a coin flip, so the selection procedure itself has no predictive power and the whole search is rejected regardless of how good the top config looked. If it comes back 0.20, the in-sample winner reliably stays strong out-of-sample and your selection is trustworthy.
The deflated Sharpe ratio#
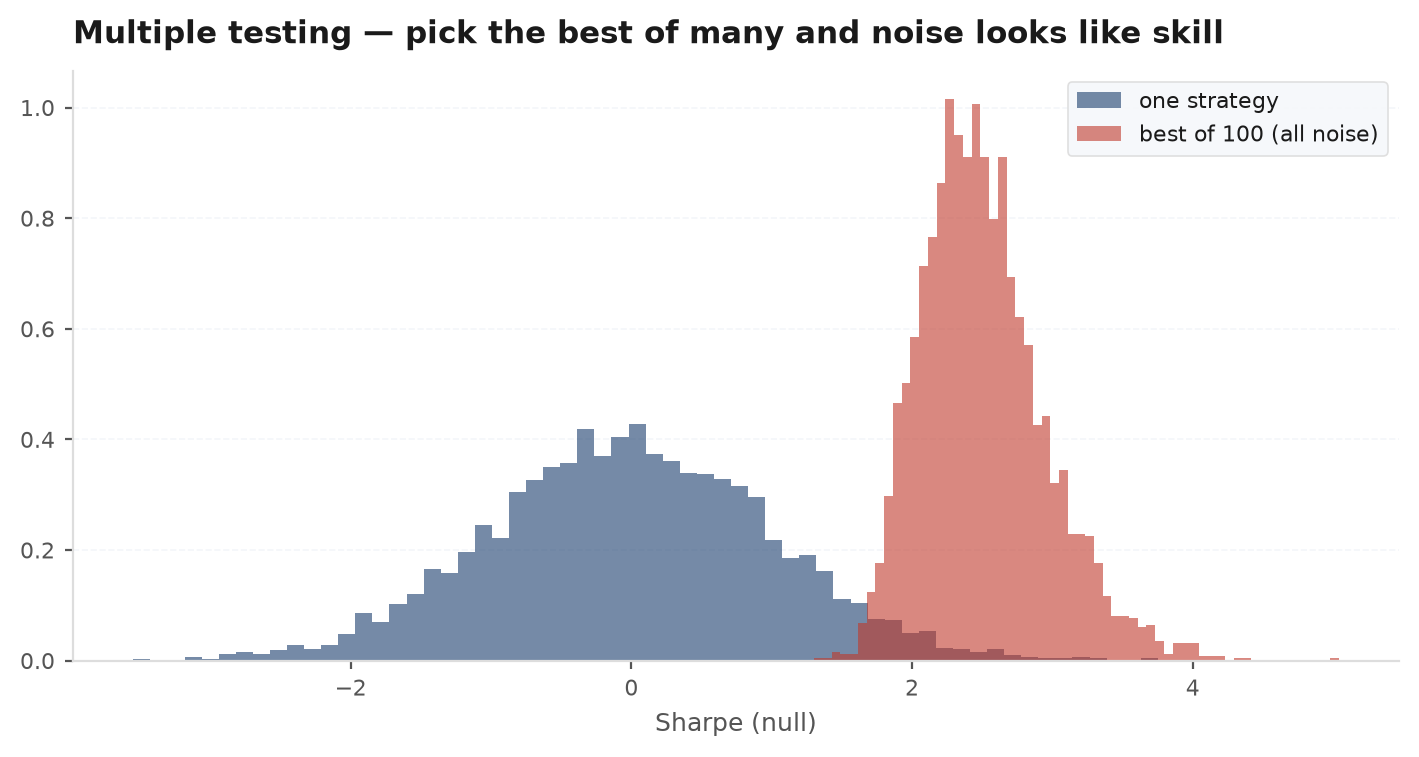
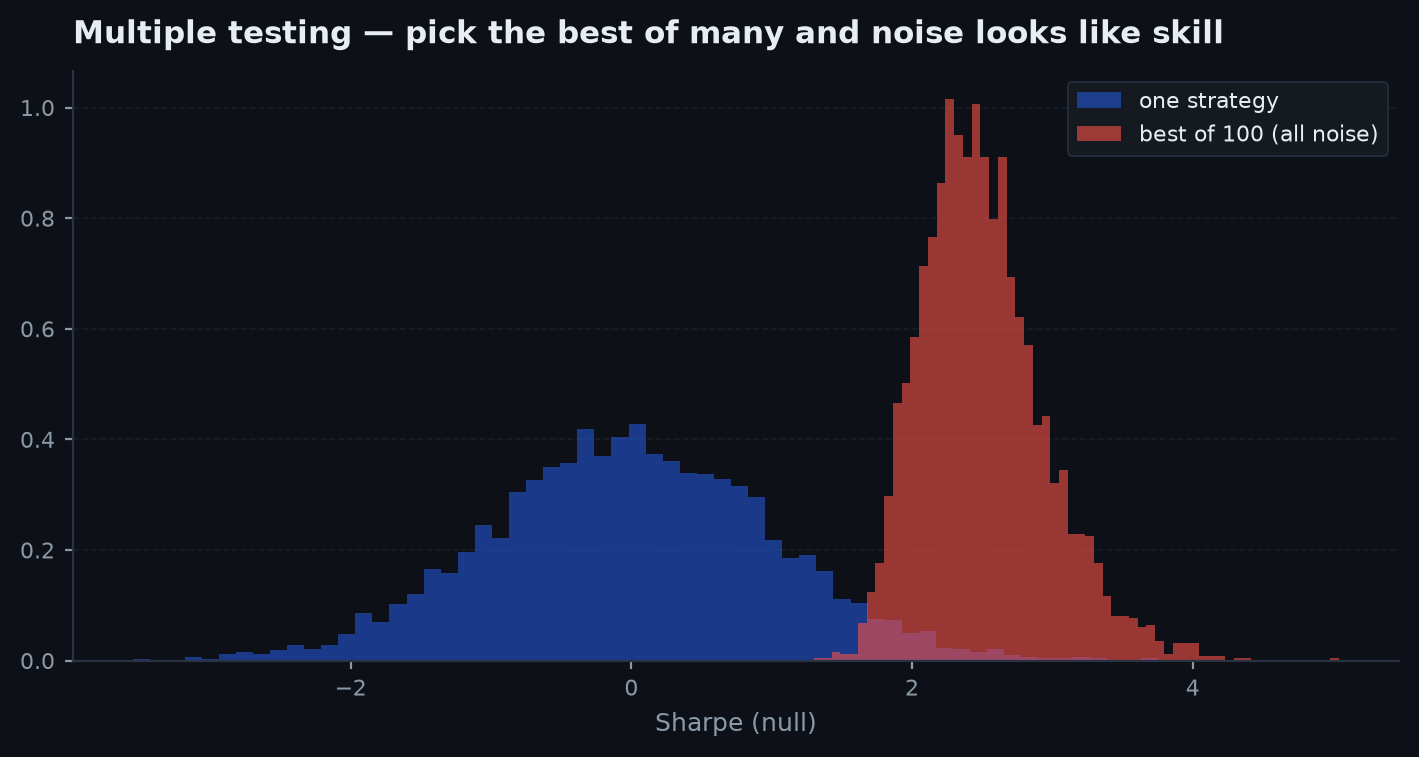
Try enough strategies and a Sharpe of 2 appears from noise alone. The deflated Sharpe ratio (DSR) corrects the observed Sharpe for the number of trials that produced it, then converts to a probability that the true Sharpe is positive.
The expected maximum Sharpe under the null#
The core insight: if you run independent strategies with zero true edge, the best of them still has a positive Sharpe by luck, and its expectation grows with . With the standard deviation of Sharpe across trials, the expected maximum is approximately:
where is the inverse normal CDF and the Euler–Mascheroni constant. This is the benchmark your winner has to beat. The DSR discounts the observed Sharpe by it and applies a skew/kurtosis correction to get a probability:
with the skew and the kurtosis of the returns. You want .
import edgekit as ek

# n_trials = how many configs you actually searched; sr_std = spread of Sharpe across them
dsr = ek.validation.deflated_sharpe(winning_returns, n_trials=100, sr_std=0.03)
print(dsr) # probability the Sharpe is real; want > 0.95sr_std = 0.5 across your configs, the expected maximum under the null, , already lands near 1.3 — so a big chunk of your 2.1 is just "best of 100 dice." Feeding n_trials=100 into deflated_sharpe discounts the 2.1 by that 1.3 benchmark and, after the skew/kurtosis and sample-length terms, returns DSR ≈ 0.70 — below the 0.95 bar. The honest verdict: the winner is probably real-ish but nowhere near a Sharpe-2 system, and on these trials it fails to clear the multiple-testing correction. Now imagine you under-reported and typed n_trials=1: DSR jumps past 0.99 and you ship an overfit. The correction is only as honest as the trial count you feed it.n_trialsis the number of configurations you searched — including the ones you discarded and the ones you tried "just to see". Under-reporting trials is how a p-hacked strategy passes DSR. If you cannot count them, the deflation is meaningless, and you should distrust the winner by default.The three together#
These are complementary views of the same danger. param_sweep asks whether a single strategy is robust to its own knobs; pbo_cscv asks whether your selection procedure across many configs has any OOS power; deflated_sharpe asks whether the winning Sharpe survives the multiple-testing correction. A strategy worth sizing shows a plateau, PBO below 0.35, and DSR above 0.95.
| Diagnostic | Asks | Pass |
|---|---|---|
param_sweep | Is one strategy robust to its knobs? | tight spread, high median (plateau) |
pbo_cscv | Does IS-best predict OOS? | PBO < 0.35 |
deflated_sharpe | Does the Sharpe survive n_trials? | DSR > 0.95 |
Next: Alpha vs beta — separating genuine skill from leveraged market exposure, and the honest haircut you apply before believing any of it.